
What are electric vehicles charging strategies, and how can connected mobility help you make the best of it?

Keila González
Data Scientist

Are you a user of electric cars? Are you planning to make the change?
Their lower annual mileage costs compared to fuel-based ones and lower CO2 emissions are just some of the many benefits.
But there are also factors that hinder EVs’ widespread adoption. Their higher purchase prices and the uncertainty of fulfilling mobility needs are the main obstacles behind their modest penetration rate [1–2]. The latter relates to their range, charging time, and charging station availability.
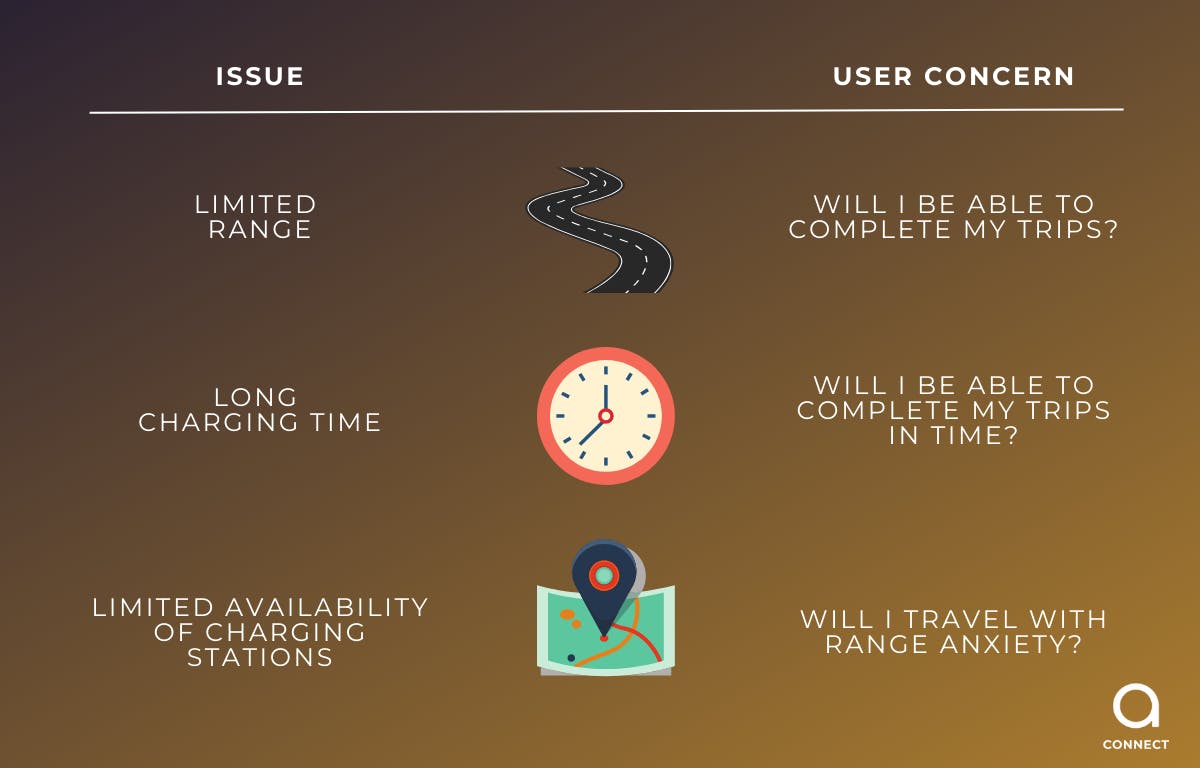
Figure 1. Selected factors hindering EV’s widespread adoption. Source: astara Connect.
Currently, several efforts are aimed at tackling these issues: newer EVs with greater ranges, improved fast and portable charging equipment, and the deployment of charging infrastructure and facilities are increasing worldwide.
In addition, there is also research aimed at optimizing our vehicles’ driving, idle, and charging times while satisfying our mobility demands, preserving the battery’s life, and utilizing renewable energy resources more effectively [3–5]. These are charging strategies.
What are charging strategies?
Charging strategies can refer to two things. The first defines planning or actions destined to achieve optimal distribution of the charging capacity among a series of vehicles in a given charging station [5–6]. In plain English, strategies to charge vehicles without draining the local electricity grid’s capacity. They are planned and executed by the local distribution system operator (DSO). They could set the same load to every vehicle, assign higher power to those that arrive first, or give preference to specified vehicles like in Fig. 2.
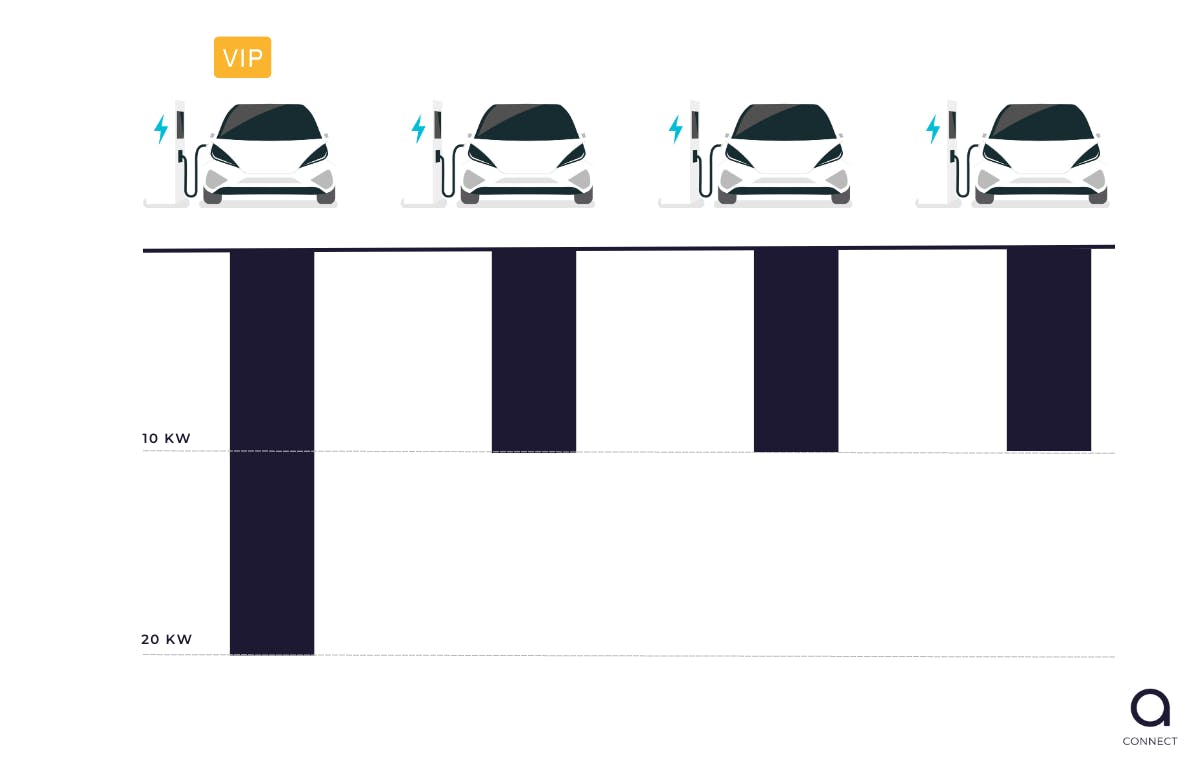
Figure 2. Charging strategies for electricity grid’s stability. Source: astara Connect
The other meaning associated with charging strategies, and the one with utmost interest for us, is the one that defines the series of actions destined to optimize the use of the EV. These strategies focus on the individual behavior of users (individual EVs or fleets) and are applied by the final user.
Charging strategies answer the question: How can I organize my trips and charging time to get the most out of my EV?
From here, things are going to get interesting :D.
One thing in common between fleet coordinators and individual EV owners is the desire to satisfy their transport demands within their economic and time constraints. In this case, the financial constraints refer to the vehicle’s total cost of ownership (TCO), which is all the critical costs of owning and running a vehicle, from purchasing to fuel/electricity expenditures, maintenance, spare parts, insurance, etc. Time constraints are defined by the purposes of our trips and the timing we have available to carry them out.
What economic challenges do EVs pose compared to internal combustion engine (ICE) vehicles?
The first one is the already mentioned initial cost. This burden might be easier to overcome by medium or big-sized companies than by smaller companies, self-employed drivers, or lower-medium-income families. As a response, many governments have implemented programs to provide funds for renewing the stock of cars with specific incentives for EVs and Plug-in hybrid electric vehicles (PHEVs) [7–9].
The second challenge relates to the vehicle’s longevity. For ICE, the critical task is to cover a considerable number of kilometers traveled without any major technical failure. EVs add to these considerations the battery’s state of health (SoH), which directly affects the battery’s End-of-Life. As known, batteries deteriorate with time due to factors such as the number of charging cycles, temperature, depth-of-discharge (DOD), working voltage, and more [10].
Expanding the EV’s longevity requires balanced driving, charging, and idle time (Figure 3).
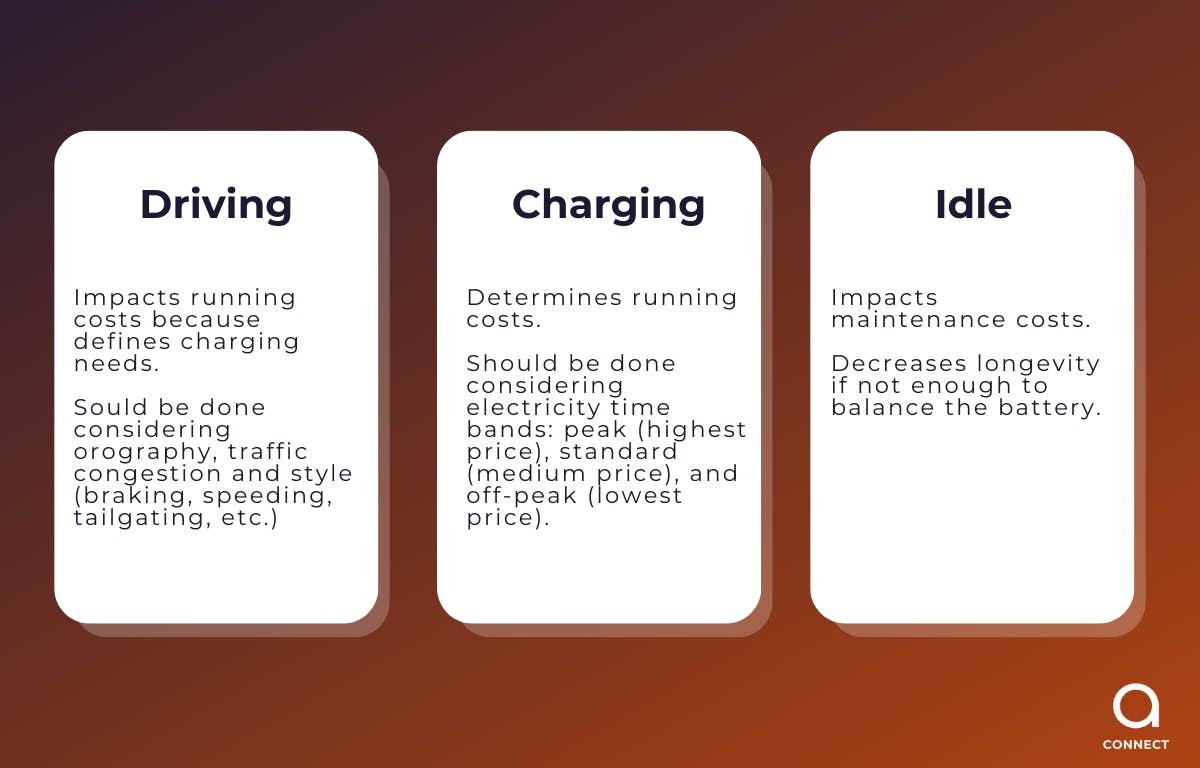
Figure 3. Impacts of driving, charging, and idle times. Source: astara Connect.
An efficient charging strategy would help us meet our mobility needs while implementing a charging scheme that preserves the battery’s SoH. It is an optimization task where we want to accomplish a set of mobility key performance indicators (KPIs) with a reduced range and a charging plan that considers the battery’s health. Written like that, it could seem unattainable, but it can be achieved with strategic planning and the proper tools.
Why should I bother implementing a charging strategy?
There are significant contributions to the scientific community on the importance of charging strategies [1–5]. Neubauer et al., 2012 employed three months of recorded data from almost 400 vehicles to quantify the effects of charging strategy, range, and driving patterns on battery economics [2]. Similarly, Lunz et al. presented research on the influence of charging strategies on battery degradation costs [3].
If the battery’s longevity is as important to you as it should be, this is one reason.
To our knowledge, one of the most detailed contributions to the topic was made by the scientific article “Charging Strategies for economic operations of electric vehicles in commercial applications” by Schücking et al. [4]. The authors presented and discussed different charging strategies for two specific mobility purposes and drove more than 450,000 km from 2013 to 2015. Like Neubauer et al., 2012, they got empirical evidence that increasing the frequency of charging (e.g., multiple daily charges) would affect battery life. The authors accessed the vehicle’s telemetries via data loggers connected to the CAN-bus and reviewed the battery information provided by the OEM (Original Equipment Manufacturer). Also, they installed an on-board diagnostic system (OBD). These authors intended to increase the kilometers traveled by testing different charging schemas.
If increasing your annual mileage is one of your mobility KPIs, this is another reason.
Enough from academia, and what about the industry?
At astara Connect, we have dedicated data scientists evaluating the advantages of EV over ICE vehicles, combining geospatial data analysis with dedicated SoH monitoring. Like Schücking et al., we obtain information from OEMs, OBD, and CAN-BUS loggers. We also believe that monitored mobility and charging strategies are essential to get the most out of your EV. astara Connect can also help private owners plan their charging strategies, unlike dedicated fleet management solutions (usually aimed at groups of vehicles).
Okay. But how can I implement a charging strategy anyway?
If you plan to enjoy your EV with the least amount of planning possible and have neither time nor desire to implement a charging strategy, you will be pretty fine following some general guidelines 🙂:
- To keep your electricity bill low, remember to check electricity time bands and charge accordingly.
- For maximizing battery longevity, remember that your Li-Ion Battery feels most comfortable in the 20–80 % state of charge window.
- For daily commuting, it is usually not necessary to charge 100 %.
- Plus, make sure that your fast charging vs. conventional charging ratio is not too high.
For those of you willing to read a little more, here we go:
A basic charging strategy would require the following:
First, we need to examine our mobility needs and the performance of our EV.
Implementing charging strategies requires obtaining detailed data from trips and your vehicle or fleet. Initially, it requires a concrete definition of your mobility/transportation demands, preferably as KPIs. Then, the necessary trips must be characterized following time and location criteria. The timing and location of the trips will determine the driving/charging/idle time available (Figure 5) and the convenient charging facilities.
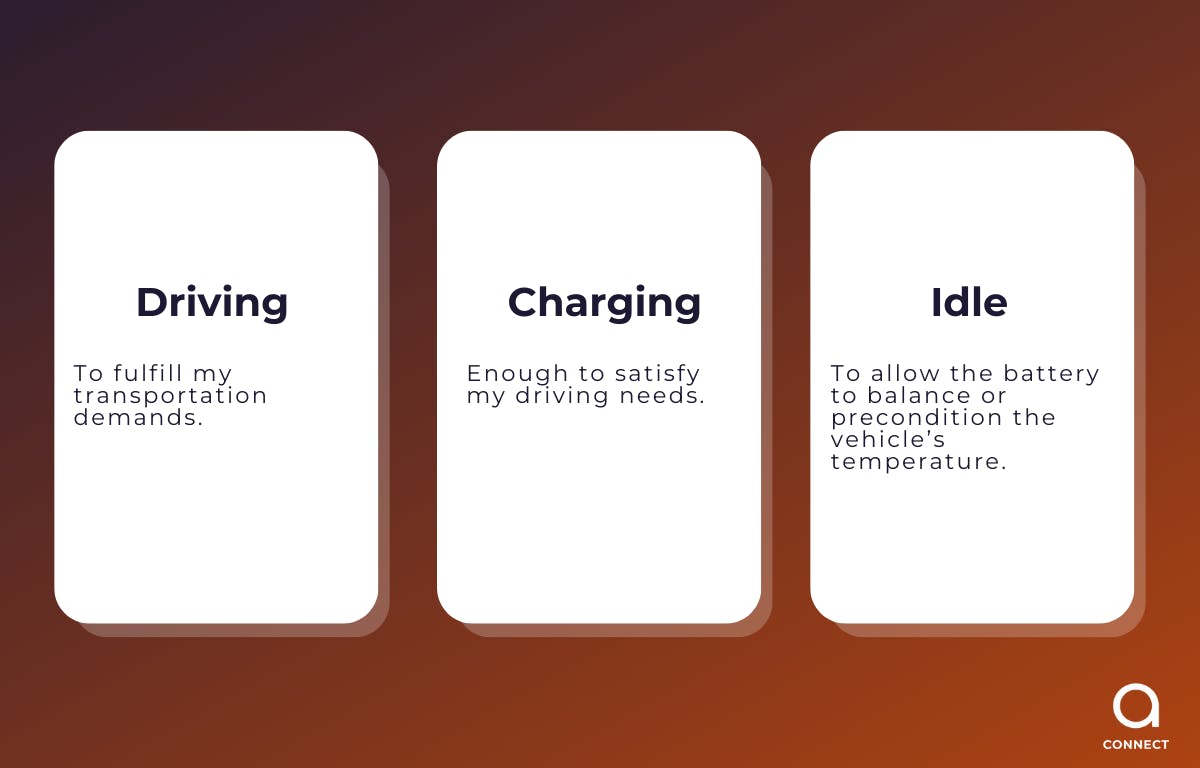
Figure 4. Essential components of charging strategies. Source: astara Connect.
Research shows that privately owned EVs are idle 95% of the time, leaving plenty of time for meeting our mobility needs [11].
Outline Transportation/Mobility requirements.
It is more common for companies to outline their transportation necessities than for private owners to examine their mobility in detail.
Common transportation goals for commercial fleets are to increase the number of tasks completed (delivered goods or passengers), increase yearly mileage, schedule adherence, etc. For private owners, these could be satisfying trips with different purposes (commuting, education, leisure, personal care, care for others, etc.).
How many of my trips can be planned? How frequently do we go on trips without a fixed origin/destination (O/D)? What is my average trip distance? What route has more charging facilities?
Characterize trips.
Once our compulsory and most common trips are identified, they must be classified, attending to their schedule and route flexibility. Some valuable data to gather are displayed in Tables 1 and 2.
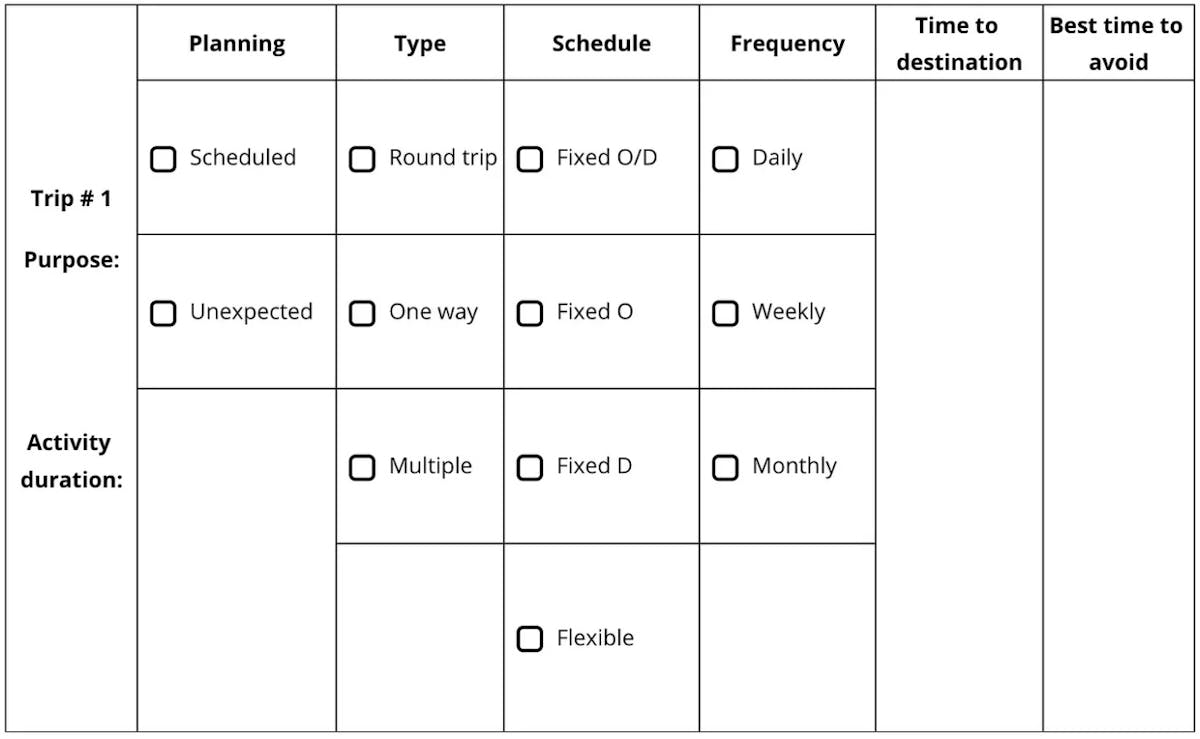
Table 1. Trip’s timing characterization. Source: astara Connect.
Table 1 summarizes data on the trip’s programming and duration. ‘Planning’ refers to whether the trip is known in advance; ‘Schedule’ specifies the existence of exact times for departure or arrival. ‘Best time to avoid’ indicates the worst traffic window for a specific city.
Self-evidently, trips that are not constant in routing or schedule are more challenging to fit into a strategy. Still, there are a lot of insights that can be gained by looking at statistics of our past trips (Figure 6 and Figure 7) and improving any aspects that are susceptible to modification. Metrics such as weekly trips, average trip distance, and maps displaying our past trip routes could help us Identify valuable patterns.
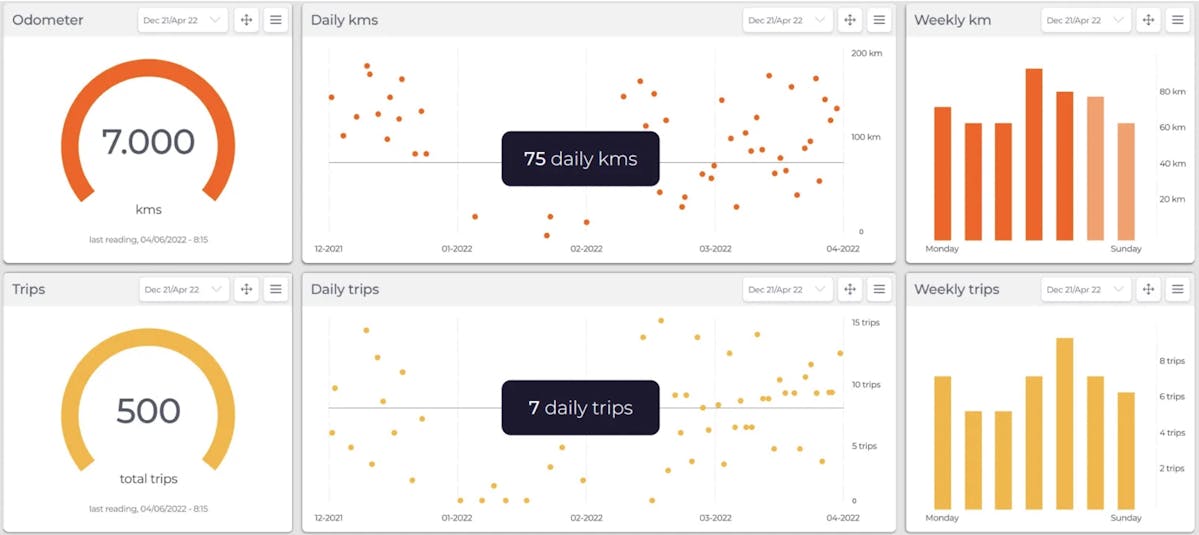
Figure 5. Statistics displayed by astara Connect’s dashboard. Source: astara Connect.
Table 2 shows information related to the geospatial characteristics of the trip and frequent routes.
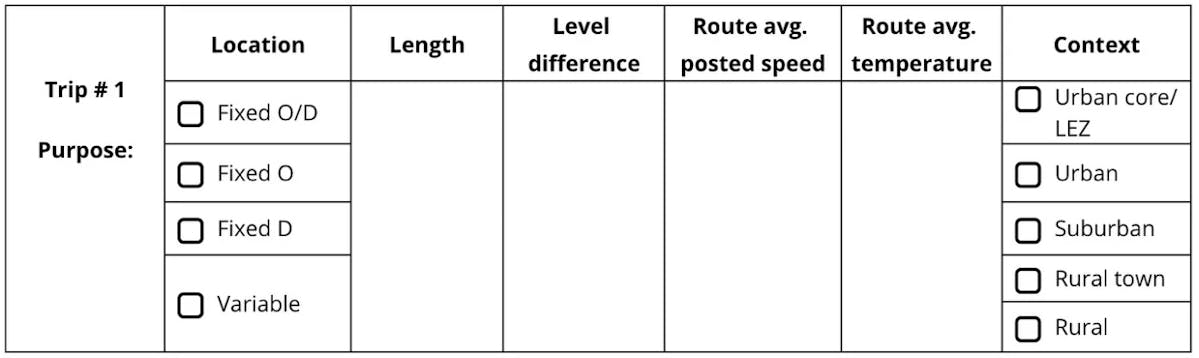
Table 2. Trip’s routing characterization. Source: astara Connect.
Connected mobility services could provide information like the one in Table 2 (and several more).
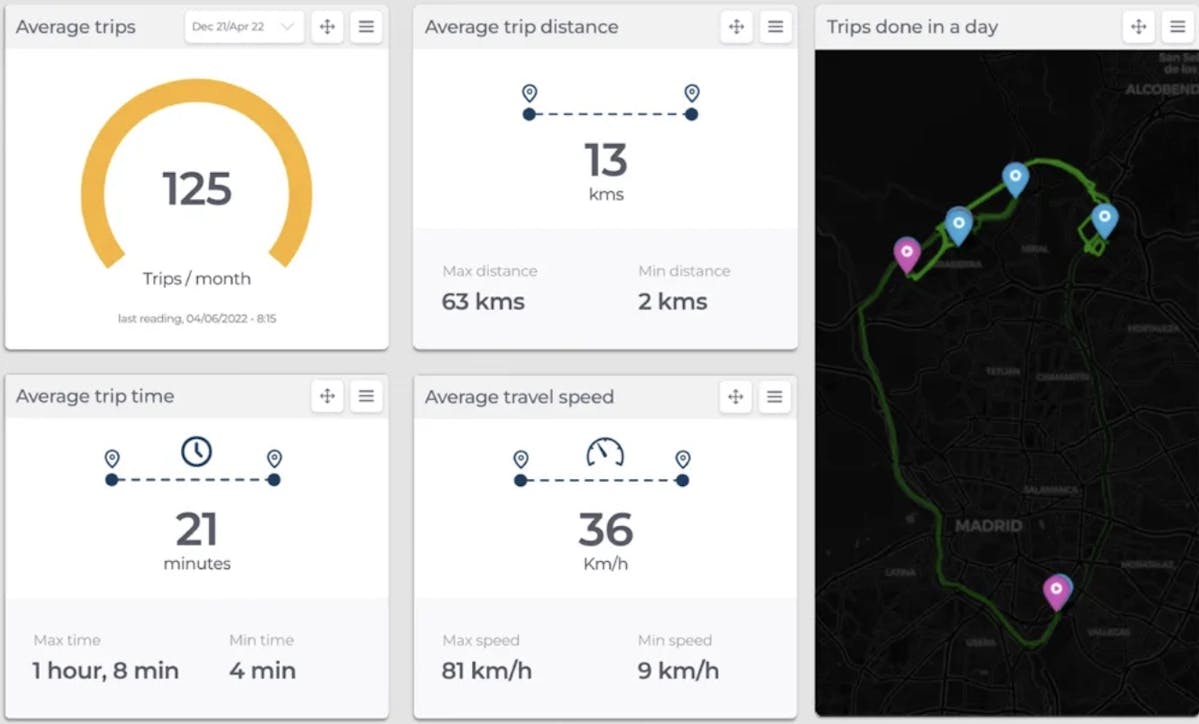
Figure 6. astara Connect’s trip information. Source: astara Connect.
Identify convenient EVSE and calculate your EVs’ real consumption.
Identifying the available electric vehicle supply equipment (EVSE) in our most visited locations is critical. The availability of EVSE has been increasing worldwide in the last few years, with China showing the highest increase, followed by Europe and the USA [12]. Conventional and fast charging stations can now be found in offices, supermarkets, shopping malls, etc. For private owners, chargers at residences and workplaces are the most used, whereas fleets from large and medium-sized companies usually have charging infrastructures at disposition. Moreover, many cities worldwide are establishing electric mobility hubs that pose a solution for self-employed drivers.
2022 has recorded the highest expenditures on alternative fuels and electricity in Spain, as the National Statistics Institute reported [13–14].
Figure 8 shows astara Connect’s heatmap with the most common trajectories and a proposal of charging points along the route.
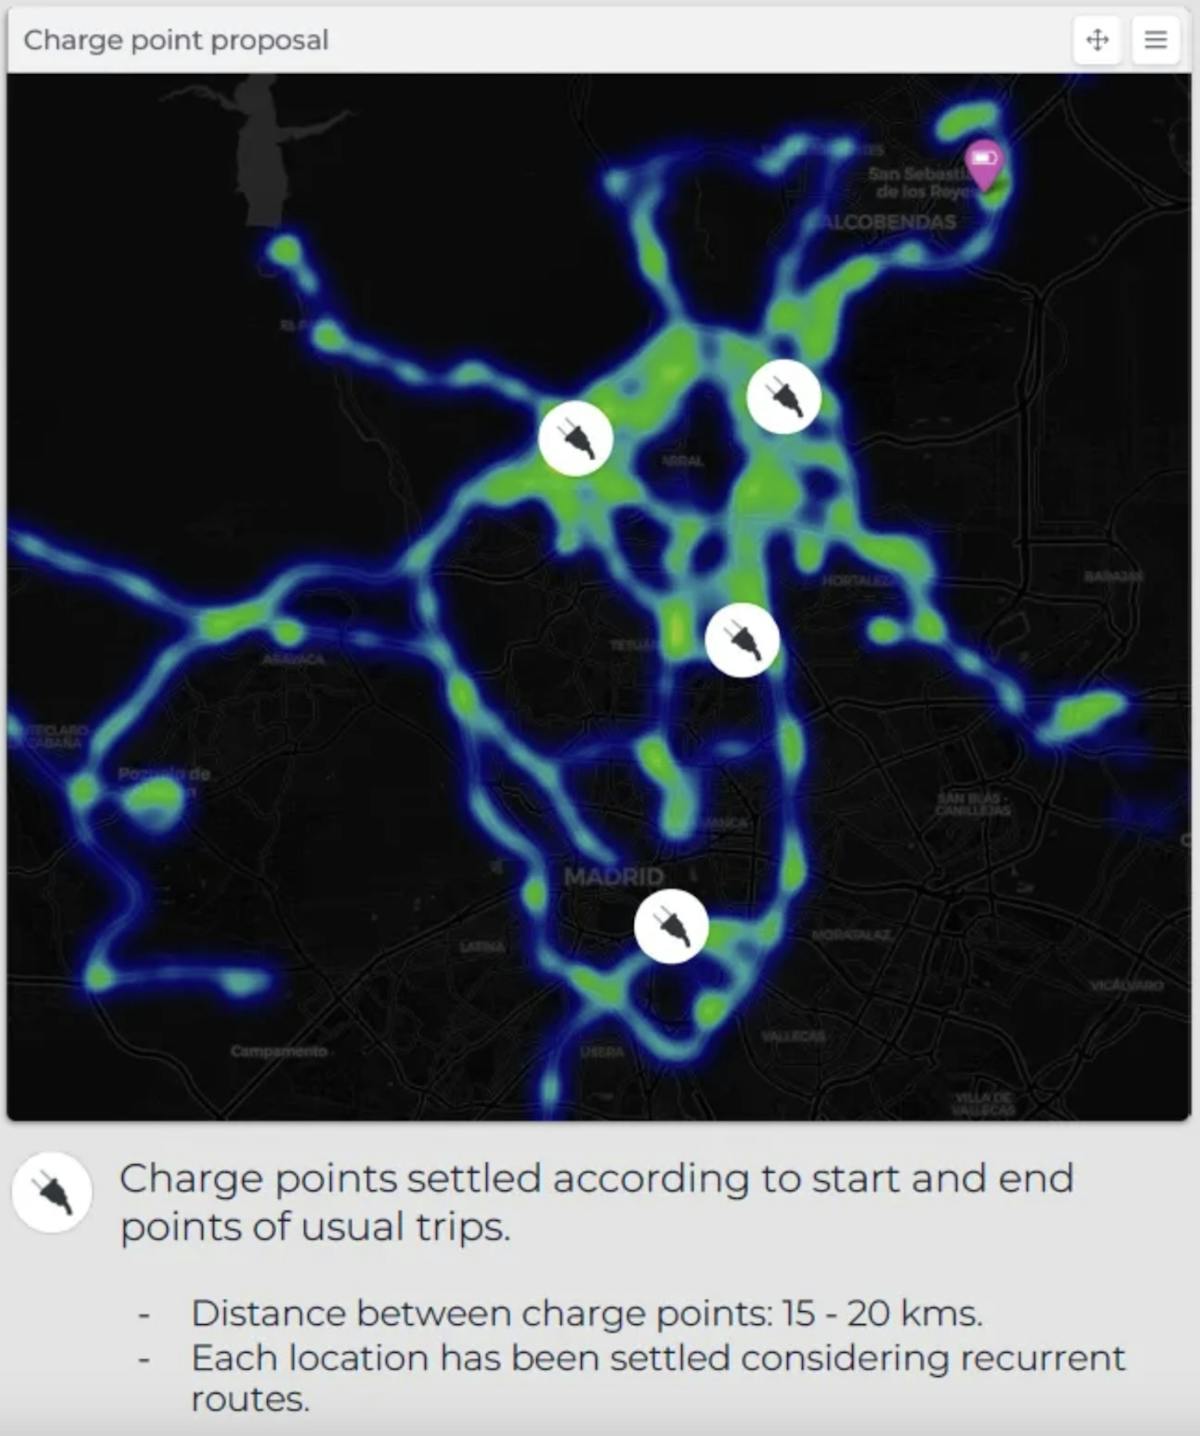
Figure 7. astara Connect’s route analysis and available charging stations. Source: astara Connect.
The next step would be knowing the metrics and statistics that define the performance of our EV. These details include battery capacity, maximum voltage, cell technology, maximum range, cabin preconditioning energy, plug type, charging modes, charging power, etc. Some of these metrics are known at the purchase but vary in reality.
At astara Connect, we plot battery charge cycles in detail to obtain relevant energy consumption metrics. Also, the required time for a full recharge, the achieved State of Charge (SoC), and more (Figure 9).
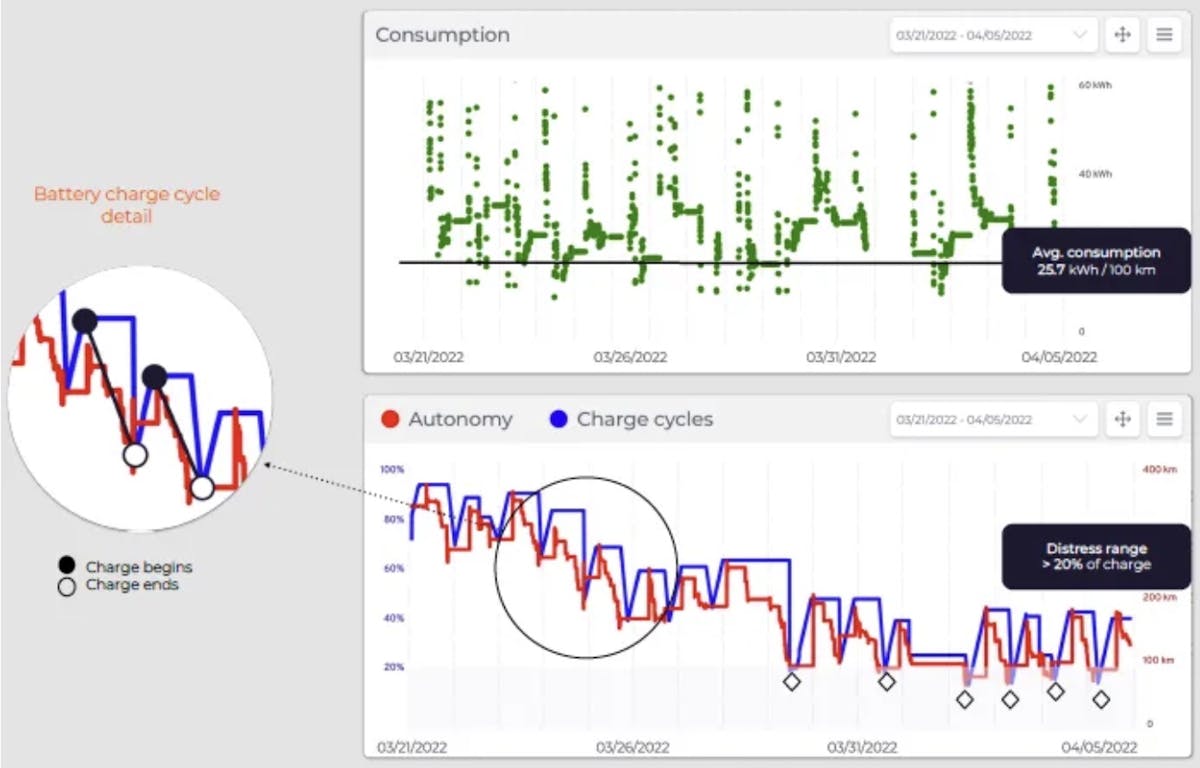
Figure 8. Consumption analytics. Source: astara Connect.
Table 3 shows basic information related to the available charging facilities.
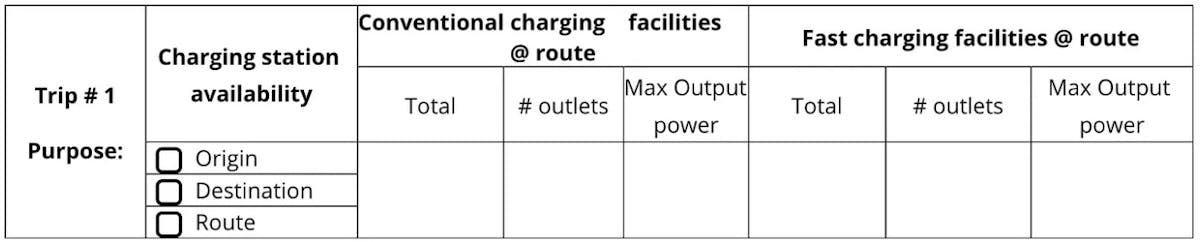
Table 3. Charging facilities characterization. Source: astara Connect.
Lastly, the EV’s basic technical details (Table 4).
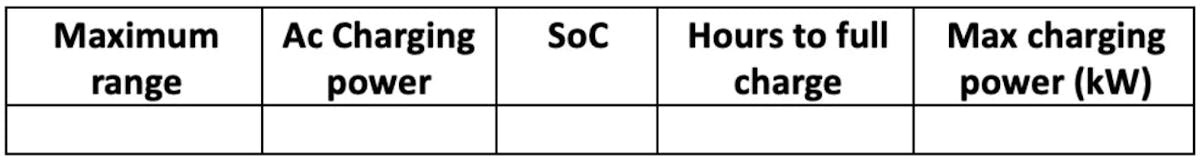
Table 4. EV’s basic technical details
Second, we must arrange our driving, charging, and Idle time.
Once all the information is gathered, we must divide our time windows between driving, charging, and idle. This segmentation should be done considering the following:
- We should prioritize conventional charging events over fast ones because the former gives enough time for the battery’s passive balancing.
- Those hours of the day with the lowest demand on the grid are always preferred to ensure grid stability and save on running costs (if the peak, standard, and off-peak scheme is implemented).
- Increasing the kilometers traveled should not punish the longevity of the EV. Ensuring this requires constant monitoring of the Battery’s SoH and adapting the strategy accordingly.
The charging strategies introduced by Schücking et al. [4] highlighted the following KPIs:
![Table 5. Charging strategy KPIs. Source: Schücking et al. [4]](https://images.prismic.io/boton-blog/1e4a8acf-4538-4cdb-8d19-0ce6fc0af955_Image+3-10-23+at+09.19.jpeg?auto=compress,format&rect=0,0,1369,356&w=1200&h=312)
Table 5. Charging strategy KPIs. Source: Schücking et al. [4]
These KPIs allow us to measure our mobility (distance traveled) and time availability (idle time) while monitoring our EV performance (ratio driving/charging). Fast charging events are monitored to avoid excess use and prevent aging effects.
Schücking et al. used these KPIs to monitor five charging strategies conceived for two mobility purposes: commuting and business trips. In each case, the company’s goal was to increase annual mileage. Both trips had constant routes, one-way distances that did not exceed the range of the EVs, and trips that were possible with short recharging cycles. The EVs used in the study were an e-Wolf Delta 2, an e-Wolf Delta 2 EVO, and a Nissan Leaf. The first charging strategy for commuting trips consisted of conventional charges at home and the office, allowing an annual mileage of approximately 36,000 km. The second strategy sought to increase that yearly mileage by adding another trip. To make this possible, the conventional charging at the office was replaced by fast charging. The annual mileage increased to 54,000 km. The third strategy aimed to expand this mileage even further but was not sustainable because the charging time was insufficient to cover the new distances.
Table 6 shows the KPIs for the strategies described. The first thing to notice is the lack of idle time in Strategy 3 and its large ratio of fast/conventional charging. The 300 km could not be traveled by implementing this strategy; regardless, this scheme would not be optimal for battery longevity.
![Table 6. Charging strategies for commuting trips. Source: Schücking et al. [4]](https://images.prismic.io/boton-blog/78482b2b-0c63-4e38-af7e-718bd0bcc5cc_Image+3-10-23+at+09.19+%281%29.jpeg?auto=compress,format&rect=0,0,1366,592&w=1200&h=520)
Table 6. Charging strategies for commuting trips. Source: Schücking et al. [4]
How about a basic example?
Example 1:
Private owner — use: Commuting
Let’s suppose that a private owner only uses their car for commuting four days a week with flexible times for the beginning of their shift (7 AM -10 AM). They can also choose a day to work remotely. The origin and destination are in Suburban parts of Madrid. The user has a conventional charging station at home and a DC (direct current) fast-charging installation at the office. This information is summarized in the following tables:
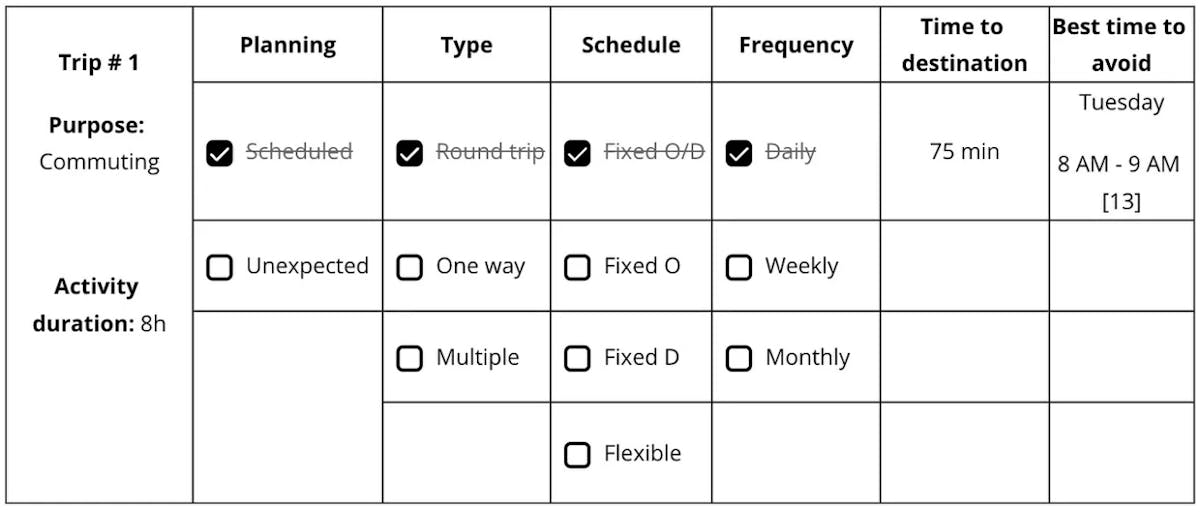
Table 7. Commuting trip’s details.
First, Table 7 dictates the hours of the day and the frequency of the driving task.
Next, information regarding the trip’s location is included in Table 8. The origin and destination are fixed, and the duration of the activity is quite long; hence, the optimal setting would be charging at home or the office, avoiding peak electricity prices. If these locations lacked charging equipment, EVSE had to be found near the origin or destination; this should not be too difficult in a suburban setting. Neither the temperature nor the slope difference have extreme values and should not impose too much burden on the EV.15
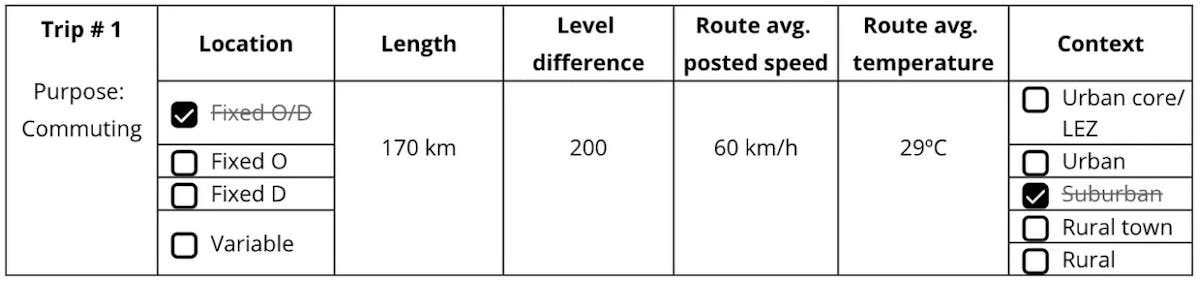
Table 8. Trip’s location details.
Next, the trip’s length must be compared to the EV range to determine the required charging events and available time.
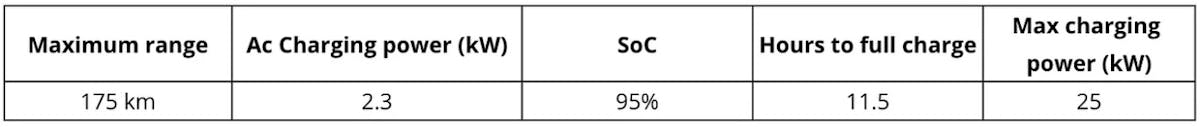
Table 9. EVs technical details.
The range of the EV is greater than the trip’s length, but to avoid any range anxiety, the user decides to add a charging event to its schedule.
In the first strategy, the user leaves for work at 7 AM (because 8 and 9 AM are the most congested overall in the city [15]). From 2–3 PM (his lunch break), he fast charges the battery at work because the highest electricity price in Madrid goes from 10 am to 2 PM. And because the battery does not reach its lowest levels on the trip home-work, it takes less than an hour to reach 80%. He finishes work at 5:45 PM (rush hour) and goes home, where he charges his EV from 9 PM to 6 AM (off-peak electricity prices).
The second strategy involves leaving home at 9 AM (rush hour). At 4 PM, he fast charges his EV because the prices are standard at that time; this charging lasts slightly longer than in strategy 1 because the heavy traffic augments the driving time. He leaves work at 08:00 PM because he dedicates 15 minutes in the morning to set up the fast charge. Finally, he charges his EV at home from 10 PM to 7 AM.
The final step is to obtain the main KPIs for different strategies and select one accordingly. Table 10 shows the KPIs introduced by Schücking et al. [4] with the addition of two metrics. The first one is Idle time in off-peak hours to see if there are available hours of the day with cheaper electricity prices (in case of unexpected events). The second one is Driving hours during rush hours to monitor the efficiency of our schedule.
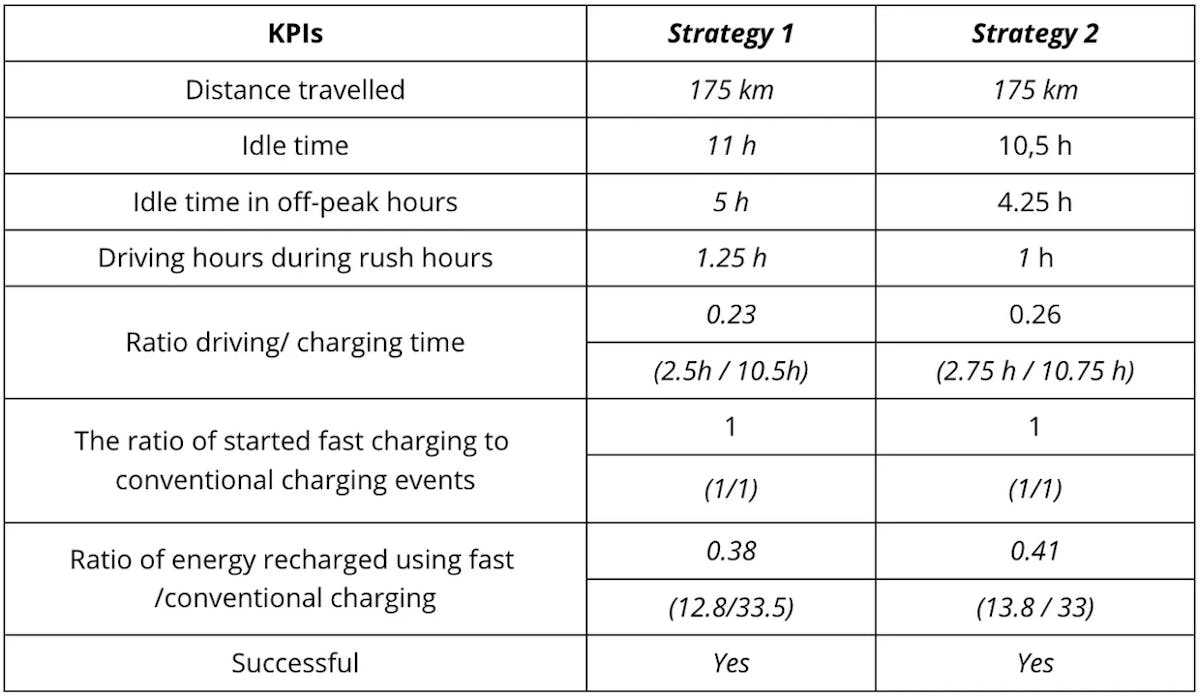
Table 10. Charging strategies KPIs. Modified from: Schücking et al.
Both strategies help us achieve the commuting without problems. In the first one, he avoids Madrid’s worst traffic time because he leaves earlier, but he experiences some heavy traffic in the afternoon. The charging hours happen mostly at low-electricity demand hours. Only the charting starting hour (9 PM) is a peak electricity one. In this strategy, the EV is idle almost 46% of the day.
In the second strategy, the one-way trip occurs during Madrid’s heaviest traffic, this increases the driving time by 15 minutes compared to strategy one. As before, the fast charging event in the office occurs at low electricity demand hours but lasts 15 minutes longer because the trip drains more energy. As this schedule ends later, the way back home encounters light traffic.
Table 10 shows that both strategies help increase the longevity of the EV because they do not overuse fast charging. The battery has enough time to balance during conventional charging. In the first one, the driver has to wake up earlier and drive longer in congested hours, but in the second, he experiences the worst traffic hours in the city. Either strategy could be chosen because the most important goals are achieved.
Conclusions
Cost savings and reduction of externalities are some of the common reasons behind the replacement of ICE vehicles with EVs. However, long charging times and restricted range are some of the reasons behind their relatively slow penetration rates.
Charging strategies help overcome these limitations by offering means to plan the charging, driving and idle time of our EVs. They help us achieve our mobility goals while keeping our expenditures down and preserving the battery life.
You can't manage what you can't measure.
Summarizing our strategies into KPIs helps to improve them and adjust them to any changes while achieving our goals. The example displayed before showed how we can easily track our routines and adjust them to get the most of our vehicle. It might seem like a lot of planning but I invite you to give it a try. At astara connect we have the tools to ease every step.
-------------
* Distress range: < 20% of charge.
References
- Moghaddam, Z., Ahmad, I., Habibi, D., & Phung, Q. V. (2017). Smart charging strategy for electric vehicle charging stations.IEEE Transactions on transportation electrification, 4(1), 76–88.
- Neubauer, J., Brooker, A., & Wood, E. (2012). Sensitivity of battery electric vehicle economics to drive patterns, vehicle range, and charge strategies.Journal of Power Sources, 209, 269–277.
- Lunz, B., Yan, Z., Gerschler, J. B., & Sauer, D. U. (2012). Influence of plug-in hybrid electric vehicle charging strategies on charging and battery degradation costs.Energy Policy, 46, 511–519.
- Schücking, M., Jochem, P., Fichtner, W., Wollersheim, O., & Stella, K. (2017). Charging strategies for economic operations of electric vehicles in commercial applications.Transportation Research Part D: Transport and Environment, 51, 173–189.
- Spencer, S. I., Fu, Z., Apostolaki-Iosifidou, E., & Lipman, T. E. (2021). Evaluating smart charging strategies using real-world data from optimized plugin electric vehicles.Transportation Research Part D: Transport and Environment, 100, 103023.
- https://www.gridx.ai/knowledge/ev-charging-strategy.
- https://cleanvehiclerebate.org/en/cvrp-info#:~:text=The Clean Vehicle Rebate Project,electric and fuel cell vehicles.
- https://www.electrive.com/2021/08/24/russia-set-to-subsidise-ev-and-battery-manufacturing/
- https://www.reuters.com/business/autos-transportation/china-announces-extension-purchase-tax-break-nevs-until-2027-2023-06-21/#:~:text=New energy vehicles (NEVs) purchased,Finance said in a statement.
- Canals Casals, L., Rodríguez, M., Corchero, C., & Carrillo, R. E. (2019). Evaluation of the end-of-life of electric vehicle batteries according to the state-of-health.World Electric Vehicle Journal, 10(4), 63.
- Camus, C., Farias, T., & Esteves, J. (2011). Potential impacts assessment of plug-in electric vehicles on the Portuguese energy market. Energy Policy, 39(10), 5883–5897.
- IEA (2022), Global EV Outlook 2022, IEA, Paris https://www.iea.org/reports/global-ev-outlook-2022, License: CC BY 4.0.
- https://www.ine.es/dyngs/INEbase/en/operacion.htm?c=Estadistica_C&cid=1254736176806&menu=resultados&idp=1254735976608#!tabs-1254736195147
- https://keilagg.github.io/pages/transport_spain.html
- https://www.tomtom.com/traffic-index/madrid-traffic/